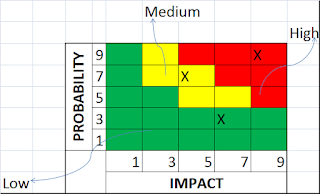
Once the probability and Impact assessment is done we can use lookup table or the probability and impact matrix. It is a 2X2 matrix, one side indicating Probability and the other side representing Impact. Have a look into the following table. The matrix is divided into three areas namely High, Medium and Low. Red is High priority, Yellow is Medium Priority and Green is Low priority. How to use this table? This table should be used in alignment with Probability and Impact assessment. For example there is a risk which is having probability with scaling of 9 and Impact with scaling 9. It falls under High risk area. Similarly a risk with probability of 7 and Impact of 5 lies under the Medium area. In this way we can use this matrix to provide ranking of each and every risk and will be helpful for further quantitative analysis and risk response planning.
Probability and Impact Matrix technique is used under the process Perform Qualitative Risk Analysis.

No comments:
Post a Comment
Thanks for your comments. Will get back to you